Setup Queue Progress Bars and Gantt Charts - Recent Improvements
Let's start from the beginning. For those who don't know, when you become a client of B2BGateway, you are granted access to what we call the "Client Portal". This client portal is an essential part of your EDI relationships because this is where you will add new trading partners that you want to trade EDI documents with, monitor the setup progress of newly added relationships and oversee relationships that have been brought into "production" as we say.
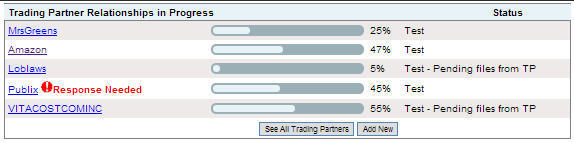
When you log into the client portal, you will notice that each relationship that has been added now has "progress bars". These bars are a quick and easy way to get a high-level overview of where the relationship stands when in the test / setup phase. This same dashboard will show you your most recently added trading partners, plus any trading partners that may require a response from you. Since we only show the top 5 most recently "touched" trading partners, if you do not see the one you are looking for, try clicking the "see all trading partners" button for the full list and their statuses.
Now that we can see all trading partners, we can see that the progress bars show the combined progress of all documents that are in the test phase for each trading partner. Next to the progress bar is a status, usually, "pending review", "testing", "in production" or "on hold". It is important to take note of any "RED" text in your client portal. This will alert you to actions that may be needed on your behalf. For instance, you'll see here with "Publix" - your response is needed and it is shown in red.
To get more detailed information on a trading partner's setup progress you can click the trading partner name or the progress bar. This page will list the all of the EDI documents that have been added to that specific trading partner's relationship. You can see each EDI document's direction, status, testing progress and the date and time of the last note. A small caveat here -- older setups may not have any information in the "last note" category unless new actions have been taken recently.
Now that we're looking at the documents that have been added to one specific relationship, we can enable the latest improvement to the setup queue, the Gantt charts. If you have access, click "show Gantt charts" at the top right of your screen and the charts will appear for each document added. These Gantt charts are built according to the normal time it would take to complete each task associated with the setup of each document. This time-line will give you a good idea if the setup is on schedule or if something might be holding it up. If you do not see these charts in your relationship window, let your support engineer know or contact the rapid response team for help.
From here, you can click on an individual EDI document or progress bar for even further detail. By doing that, you will see a condensed version of the Gantt chart as well as the last note in reference to that document and respond to any messages from B2BGateway. You can also ask a new question about the document by clicking "enter new note" on the right hand side of the screen. If you have to upload any files for this particular document, you can also do that from this screen as well.
As was said before, for each relationship, be on the lookout for red text, as this will alert you to actions that you may have to take. It is also important to note that correspondence regarding these documents should be completed inside the client portal as shown here in order to expedite setups and keep information appropriately associated with the specific documents and trading partners. Bottom line here is that entering information into the client portal is better than email.
I hope this helps everyone understand what the progress bars and Gantt charts are and how to use them. If you have any questions about anything you have seen here today, or you do not see the Gantt charts in your client portal, please contact a support engineer via the chat box found at the bottom of the screen from inside your client portal or by contacting the rapid response team at 401-491-9595.


 When you log into the client portal, you will notice that each relationship that has been added now has "progress bars". These bars are a quick and easy way to get a high-level overview of where the relationship stands when in the test / setup phase. This same dashboard will show you your most recently added trading partners, plus any trading partners that may require a response from you. Since we only show the top 5 most recently "touched" trading partners, if you do not see the one you are looking for, try clicking the "see all trading partners" button for the full list and their statuses.
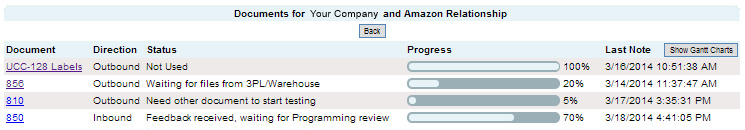 To get more detailed information on a trading partner's setup progress you can click the trading partner name or the progress bar. This page will list the all of the EDI documents that have been added to that specific trading partner's relationship. You can see each EDI document's direction, status, testing progress and the date and time of the last note. A small caveat here -- older setups may not have any information in the "last note" category unless new actions have been taken recently.
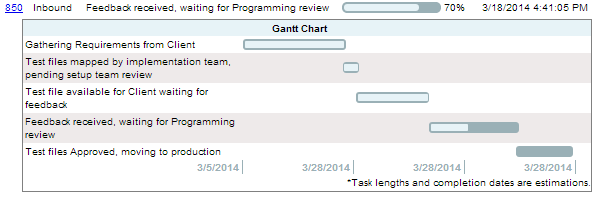 Now that we're looking at the documents that have been added to one specific relationship, we can enable the latest improvement to the setup queue, the Gantt charts. If you have access, click "show Gantt charts" at the top right of your screen and the charts will appear for each document added. These Gantt charts are built according to the normal time it would take to complete each task associated with the setup of each document. This time-line will give you a good idea if the setup is on schedule or if something might be holding it up. If you do not see these charts in your relationship window, let your support engineer know or contact the rapid response team for help.
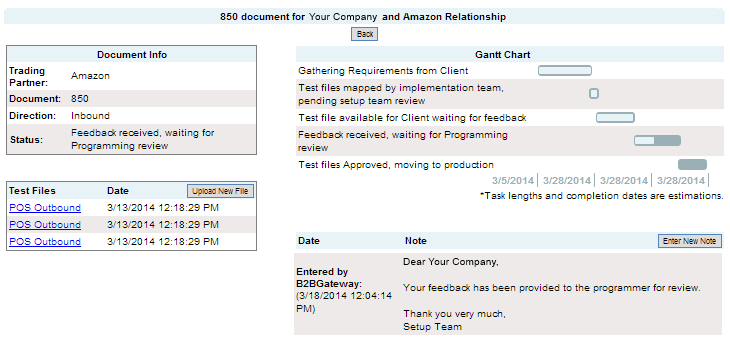 From here, you can click on an individual EDI document or progress bar for even further detail. By doing that, you will see a condensed version of the Gantt chart as well as the last note in reference to that document and respond to any messages from B2BGateway. You can also ask a new question about the document by clicking "enter new note" on the right hand side of the screen. If you have to upload any files for this particular document, you can also do that from this screen as well.